
Today you are going to learn which analytics and metrics matter for ecommerce supply chains.
This resource is different from anything else you’ll find because our goal is to list and talk through lots of examples. Few resources out there extend beyond a bland definition of analytics.
The guide will be especially interesting to ecommerce professionals because the list is sourced from veterans of Amazon and Zulily, pulling from their experience of measuring the things that mattered.
There are a lot of ways to measure the performance of your supply chain. Some are better than others. What’s most important is the understanding that an ecommerce chain is dramatically different from the ones that support older, physical business models, like brick-and-mortar (B&M) stores.
Let’s briefly talk about how to think about supply chain analytics (and metrics, KPIs, and measurement) in an ecommerce sense; then we will dive into the long list of possible options for you to pick for your own company.
Key highlights:
- Unlike traditional supply chains, ecommerce generates vast amounts of digital data at every touchpoint, making advanced analytics even more valuable.
- Analytics, metrics, KPIs, and measurement are different concepts. Measurement is the raw data collected, metrics are specific calculations derived from that data, KPIs are your most critical metrics tied to business goals, and analytics is the process of interpreting all three to drive strategic decisions.
- Supply chain metrics that matter most for ecommerce businesses include time-in-transit, inventory turnover, order accuracy, and cost-per-shipment, among others.
- Predictive shipping models, dynamic inventory management, and automated carrier selection are real-world applications of analytics in ecommerce logistics, which contribute to cost savings and faster deliveries.
What is supply chain analytics?
Supply chain analytics refers to the process of collecting, analyzing, and interpreting data across the supply chain to improve efficiency and enhance leaders decision-making process.
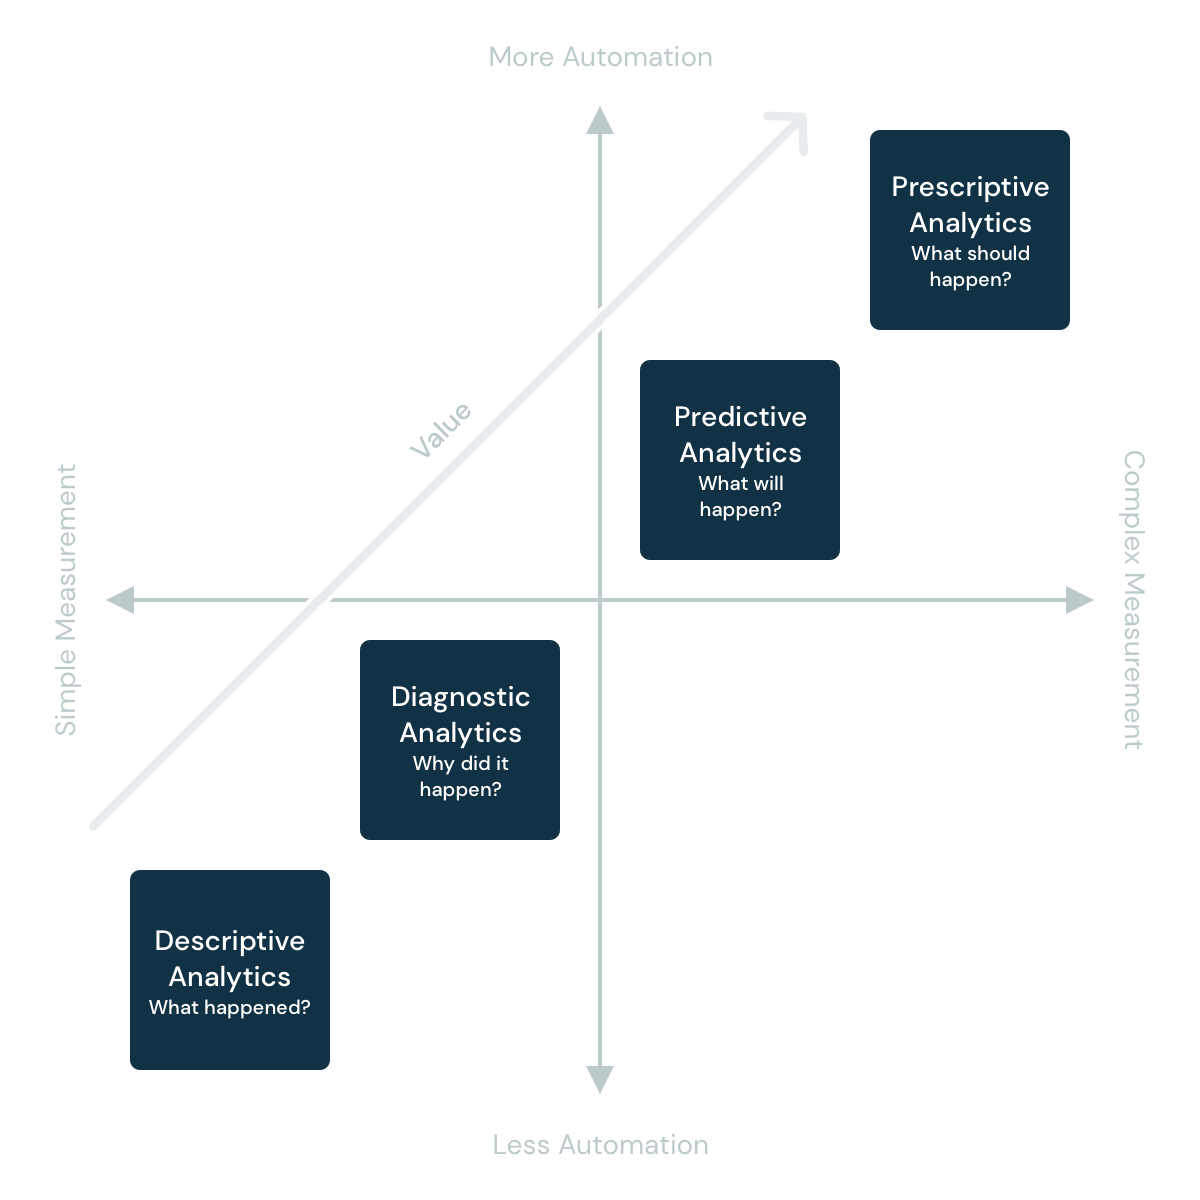
This process involves descriptive analytics (what happened), diagnostic analytics (why it happened), predictive analytics (what will happen), and prescriptive analytics (what should happen).
Difference between supply chain data analytics and metrics
Veterans of large ecommerce companies intimately understand what separates supply chain data analytics from metrics, KPIs, and measurement, but let’s quickly give a definition so the following list is easier to understand.
The definitions build on each other, almost like a pyramid.
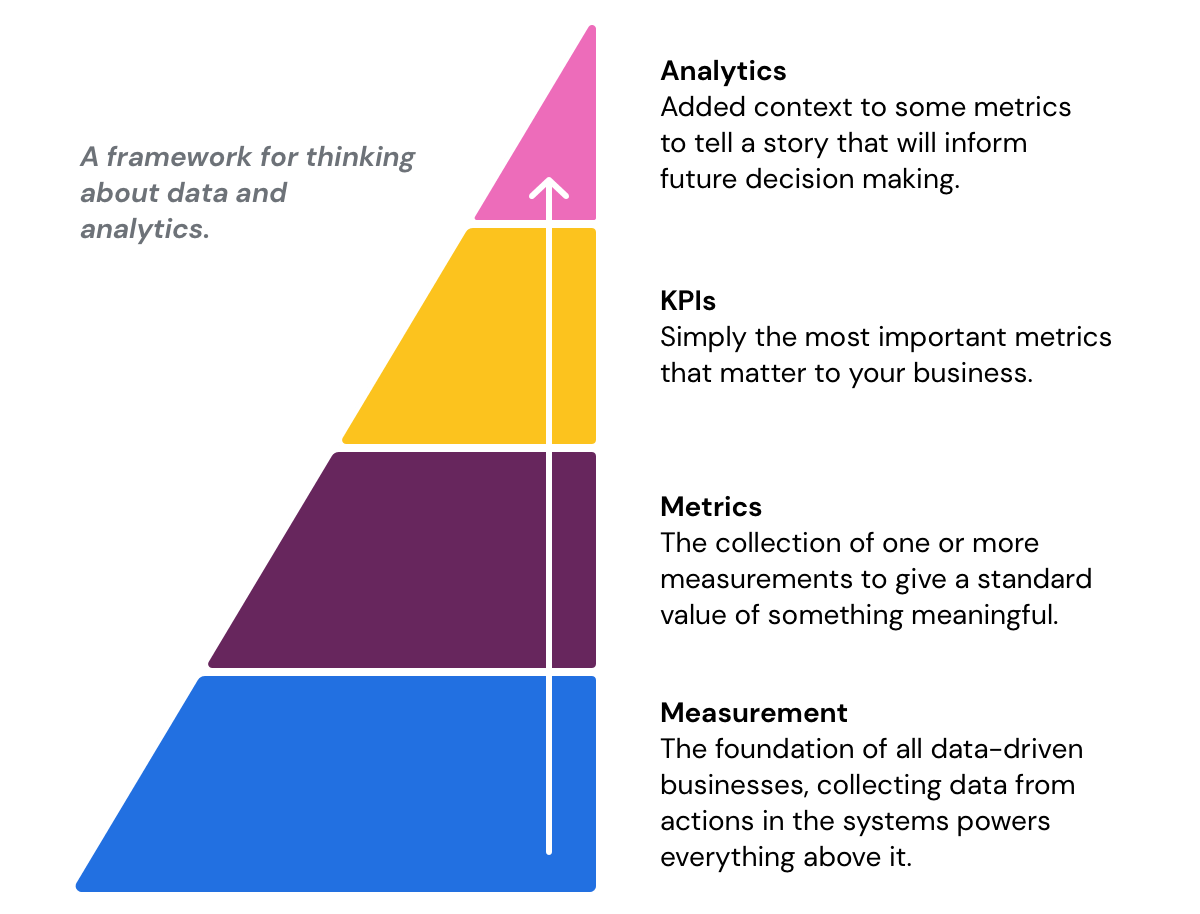
Measurement is the “how” of data collection. Measurement within ecommerce businesses is uniquely different — and better — than in physical stores. Since ecommerce systems are inherently digital, data is being shed with every “action” happening along the supply chain. Therefore, measurement is as simple as capturing the enormous amounts of data produced from every interaction within every system every second of every day.
Some examples:
- A customer views the product page.
- The store (site) calls your inventory management system to see if the product is in stock, and it’s not in stock.
- The customer sees the item is out of stock, and leaves the store.
- The customer engages with customer service to ask when the product will be back in stock.
Get the idea? The measurement of all those actions is how modern ecommerce companies gain sophisticated metrics and analytics that set them apart from the competition. It’s really hard for Office Depot to know which pen the customer wanted when passing through Aisle 12 at the store down the street, for example.
The big “ah-ha!” moment for ecommerce companies is data = measurement, and ecommerce companies inherently have a lot of data! To take advantage of it, and create metrics and analytics that boost your business, you need to store the data in a structured way and connect it with other sources of data.
Metrics are quantifiable measurements that give a standardized value. For example, “Out-of-Stock-Bounce-Rate” is a metric, and is the culmination of the measurements from our previous story. By stringing together the data, a supply chain manager can create this metric with a statement like “17% of the time a customer visited a product page, we were out of stock, and they immediately left the site.” That’s a metric.
Key Performance Indicators (KPIs) are simply your most important metrics. It might be stock levels, inbound cost-per-unit, NPS scores, whatever. You might check other metrics monthly, but you look at KPIs on a weekly or even daily basis.
Analytics adds context to a collection of metrics to inform future decision making. Continuing our story, let’s suppose the supply chain manager ended contracts with 10 suppliers last month because the company didn’t believe there was demand anymore for those 10 products. But by digging into the “Out-of-Stock-Bounce-Rate” and combining it with other data, the manager notices that over half of the bounces are for one of the suspended products. The manager can take this insight, demonstrate a missed revenue opportunity, and perhaps restart negotiations with that supplier.
Read our complete ecommerce supply chain guide.
The four families of metrics you’ll find in supply chain analytics tools
There are four types of metrics and analytics, but for the purpose of this next section, we’ll just call everything analytics.
Each type builds on the previous type towards more automated decision-making. While full automation is a dream scenario for many businesses, it simply isn’t practical, so all four types play a role in a modern data-driven company.
Descriptive
Descriptive analytics explain “what happened” at some point along the supply chain. Examples:
- SLA fill rate with Fulfillment Center A, B, or C
- Last month’s lead time with Vendor X, Y, or Z
- Total dollars spent procuring inventory last month
Descriptive supply chain analytics are the bulk of what makes up dashboards. While all four families are useful for tracking month-over-month changes, descriptive analytics are especially useful because of the guaranteed consistency of the measurements.
These supply chain data analytics are inherently simple measurements with little interpretation, which means they are less useful at automating decision making and more useful at logging rates-of-change for basic measurements over a given time period. For example, an increase in weekly inventory spend may alert you to a change happening that your partners elsewhere in the business may have forgotten to tell you about. Descriptive analytics are the foundation of all other analytics and are frequently critical in their own right.
Diagnostic
Diagnostic analytics explain why something happened. Examples:
- An uptick in “Out of Stock Bounce Rate” is due to upstream supplier delays.
- “Order to Ship” has been poor recently because “Time to Pick” is 4x what it used to be, which suggests the recent floor redesign is not going as planned.
- “Ship to Deliver” is averaging over 7 days now, when it used to be under 3, which suggests the recent shift to a USPS injection shipping method to cut costs might not be worth it.
Diagnostic analytics are most often used to assess root causes of past output or outcomes. They tend to be more of a tool you use on a specific problem versus a regular measurement over time, like descriptive analytics. You will see them deployed to understand what went wrong if a particular outcome was unexpected.
Diagnostic analytics are usually a combination of several descriptive analytics to tell a story about causation.
One of the more interesting areas we see diagnostics analytics is within simulation exercises. Few people have the bandwidth to do these exercises on their own, but they can be useful when available. A specific scenario can be played out via a simulation in order to create the upside of diagnostic supply chain data without the downside of a real-life negative outcome. Simulating a pandemic to diagnose the impact on customer demand or supplier lead time sure would have been useful to do in January 2020!
Predictive
Supply chain predictive analytics explain what will happen in the future. Examples:
- Demand forecasting
- Margin impact when bundling
- Estimating the impact of weather on shipping times
The most important thing for predictions, whether by human or machine, is having lots of data, as stated by the MIT Sloan Management Review. Predictive models need historical data to project what will happen in the future. Companies that have high quality data sources that are interoperable and structured will perform better at predictive analytics.
While segmentation can happen at any layer, it has the biggest impact on company operations with predictive insights. It’s common to segment predictive analytics by product, customer, channel, geography, and so on. This is the kind of analytics that will tell you not to purchase winter coats for Miami during summer, for example.
Prescriptive
Prescriptive analytics tell you what actions to take with some degree of confidence. Examples:
- Where to locate your next fulfillment center
- Selecting the best outbound carrier option per shipment
- Where to place inventory within your fulfillment network
Prescriptive analytics are probabilistic. Much like predictive analytics, they take a ton of data and then model outcomes. But they also consider probabilistic scenarios and suggest the best actions to take (this is what makes them prescriptive).
These supply chain metrics are deployed mostly related to performance outcomes. Minimizing shipping costs, increasing revenue and reducing in-stock levels depending on the situation are all good examples of use cases for prescriptive analytics.
40 supply chain metrics that matter to you
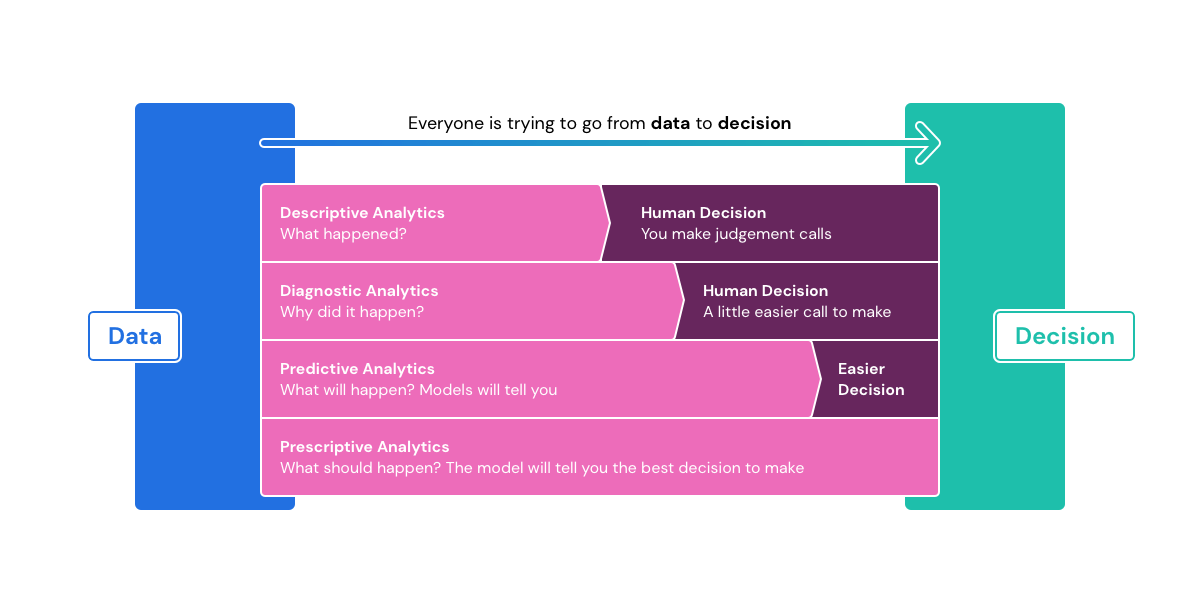
Everyone wants prescriptive analytics because of their power to automate decision-making, but we are still in an era where the practicality of that is less than marketers would have you believe. Human consideration and decision-making are still required for many tasks because of how complex supply chains and logistics can be. But prescriptive analytics go through the brute computational work for you to help make decisions easier and more informed than may be possible through other means.
Instead of jumping right to perspective analytics, you can gain immediate value by getting accurate descriptive and diagnostic analytics in place first, without which prescriptive analytics are not possible.
Based on the linear flow of goods, we’ve listed 40 example analytics and metrics to help you paint a broad picture of what’s possible — and advised — for ecommerce companies.
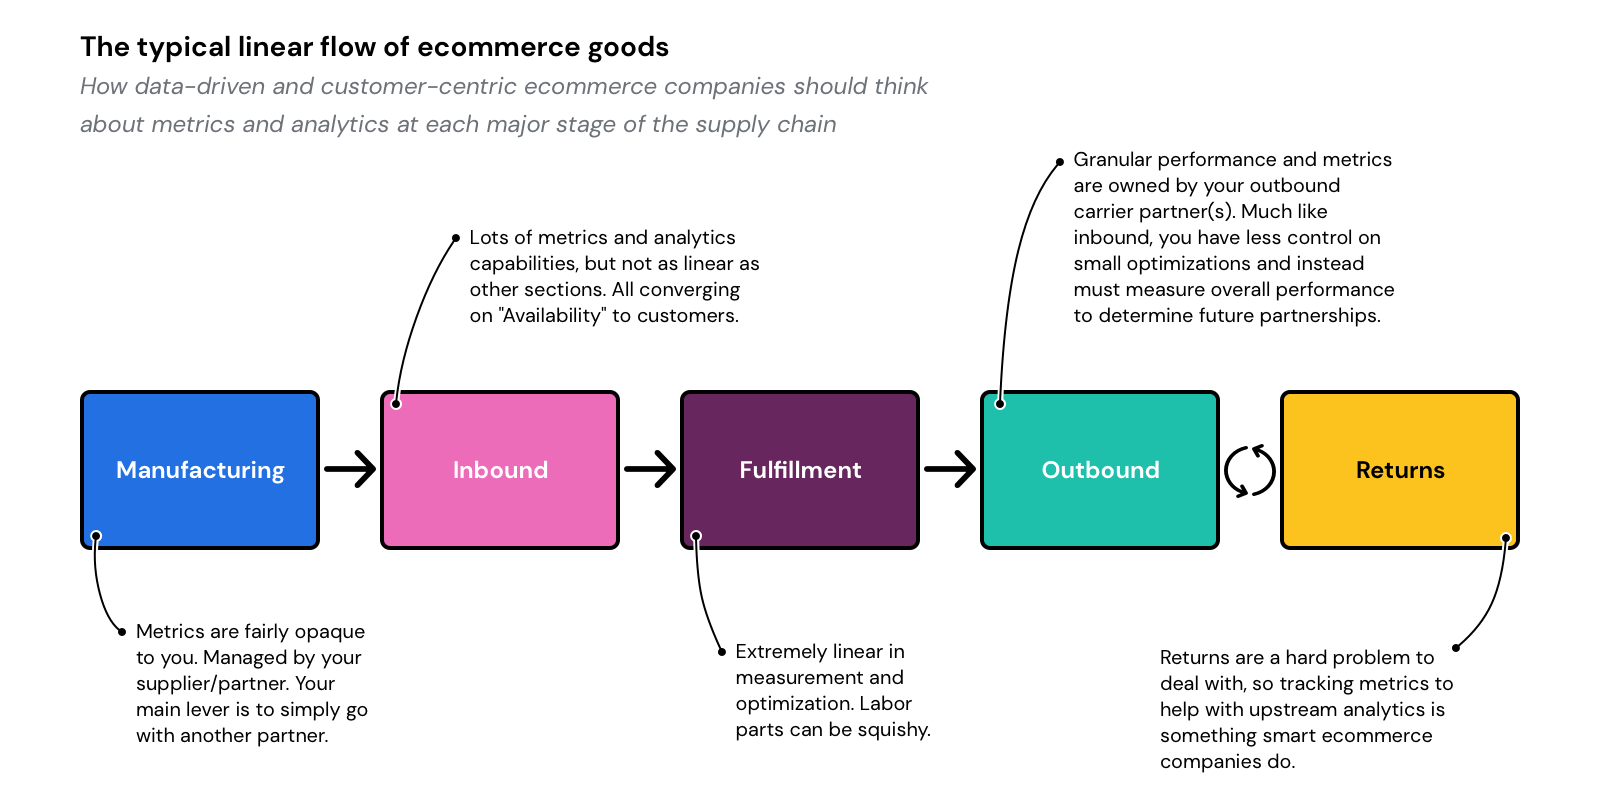
Inbound
Main inbound supply chain metrics include:
- Purchase Order (PO) Frequency - How often you cut a PO, and the associated data like volume and price.
- Mean Lead Time - Average lead time per supplier, tracked over a period of time so you can evaluate rates of change.
- Lead Time Variability - The variance of lead time per supplier. For example, tells you how often a given supplier misses an expected lead time (in either direction), and to what severity.
- Lead Time Segments - Ability to break down by individual suppliers/manufacturers to see lead time data. Additional segmentation via attributes like geography, mode (ground, air, sea), or even receiving dock (if you use more than one) are additional segmentations that move from descriptive to diagnostic when needed.
- Inbound Transit Time - How long it takes to go from the factory to your FC. Should be measured as one large metric, but it’s important to be able to do segmentation to move from descriptive to diagnostic capabilities. Examples:
- PO to Vendor Ready for Pickup - How long it takes to go from the factory to receiving dock. For example, the time it takes to get from order ready in China to your receiving dock in Seattle.
- Vendor to FC Transit Time - How long a shipment sits at the dock before going in transit.
- FC Arrival to Receive Complete - How long to go from dock to FC.
- Received to Stow Complete - How long to stow after arrival at FC.
- Cost of Inbound Transportation - Similar to time metrics above, just the cost dimension of them.
- Units Received per Hour - The number of units received at the FC per hour.
- Normalized Received Productivity - The percentage of an expected rate.
- Receive Accuracy - Compares what receivers said they would receive and what they found when a stower put the items away.
- Inbound Exception Rate - Exceptions come in many forms. Here is a quick punch list of examples to track, which should be segmented by supplier, product, etc.:
- PO Volume Accuracy - Percent rate of overage or underage delivered.
- PO Error Accuracy - Percent rate of simply the wrong stuff delivered.
- Damaged - Percent rate of goods that were damaged upon delivery.
- Lost or Stolen - Percent rate of full shipments that simply never made it.
- Prep Time (and/or bundling) - The time it takes to translate delivered goods into packaging that can be picked and packed for delivery. It might sound trivial, but for companies with custom packaging, it can be a bottleneck on the only question that matters: “Are my products ready to be sold?”
- Inbound Cost per Unit: PO frequency, PO volume, and PO price combined with inbound transit costs and geography will determine the cost-per-unit of a given order. This is one of the more important metrics impacting margin. There are a lot of variables at play and decisions to be made:
- Partially fill a container with a single order, or wait to buy in bulk in order to fill a container?
- Order only the amount of product needed for today, or buy in bulk to get a volume discount?
And so on. There is no one best practice or universal goal for this metric, but instead targets are frequently determined by geography. For example, Japan prioritizes more frequent orders at lower volumes and higher costs-per-unit due to the cost of real estate and overall storage costs-per-unit, whereas American companies receiving products from China will almost always benefit from waiting to fill an entire container before shipping across the Pacific Ocean.
Inventory
We generally define the supply chain as the flow of goods, and in the context of ecommerce, often a single-piece flow. Modernizing the supply chain means optimizing the continual movement of goods.
Inventory management, much like demand forecasting, is its own science. Indeed, there are whole books written on different ways to measure and manage inventory. The practice is intimately related to the supply chain, but is separate and large enough of a topic that it’s worth saving this discussion for a different article.
Instead of listing inventory management metrics, I’m going to provide a few concepts linking inventory to other metrics throughout the supply chain so that you understand in greater detail how much modern ecommerce supply chain analytics tools rely on the interoperability of data across multiple systems.
- Customers care about availability of the thing they want to buy. Your inventory management system will know what is available to buy. Connecting this data across systems will not only improve other supply chain metrics, but help shift you towards a more customer-centric mindset.
- Part of inventory management is the metadata associated with products stowed. Often the inventory management system will be connective tissue between other metrics.
Fulfillment
Here are key fulfillment metrics logistics leaders should be tracking:
- Order to Ship - How long it takes from the time a customer places an order to when it is handed off to an outbound carrier. It’s a composite of the following metrics within this Fulfillment category.
- Order Generation to Order Drop - The time it takes for an order from an online channel to hit the FC that will be distributing the order.
- Process Path Assignment - Different products can have different paths. How an order is assigned to which path is a step that, if manual, can cause delays.
- Time to Pick - The time it takes the assigned FC to pick all items off the shelf.
- Time to Sort - The time it takes sorting multiple items into a single order, depending on your picking process
- Time to Pack - The time it takes to pack all sorted items into your packaging. This is an area where bundling can come into play, so depending on your business, you might have an additional metric to understand how much time the bundling exercise is adding to this process step.
- Time to Load - The time it takes to load a packaged order onto trucks and handed off to an outbound carrier.
Discover 10 Shopify fulfillment best practices for ecommerce businesses.
Outbound
Relevant fulfillment metrics in supply chain analytics software include:
- Ship to Deliver - This is a sibling to Order-to-Ship and is the second half of measuring the time it takes to go from an order being placed to it being delivered. Similar to most inbound transit metrics, you don’t necessarily have control over the performance of outbound transit. What you do have control over is who you select as your outbound carrier partner, and how you negotiate rate tables across shipping methods, which is why it’s crucial to at least collect and measure the performance so you can make more informed decisions with future carrier selection.
- Send to Carrier Facility - How long it takes for the carrier to go from pickup at your FC to delivery of their distribution center (DC). Most often this isn’t a bottleneck. Sometimes, it can be, like with injection shipping.
- Last Mile Handoff - How long the package sits at the carrier DC before being loaded onto the truck for last mile delivery. Usually this is vertically integrated—a UPS driver is picking up from a UPS DC to then deliver to your house—but this could be a bottleneck area to watch if you are including a last-mile delivery partner.
- Last Mile Delivery - How long it takes to deliver from carrier DC to the customer. Often measured more in hours than days or weeks. Mostly matters when working with multiple outbound partners so you can identify hand off bottlenecks.
Learn how to reduce outbound shipping costs.
Reverse logistics
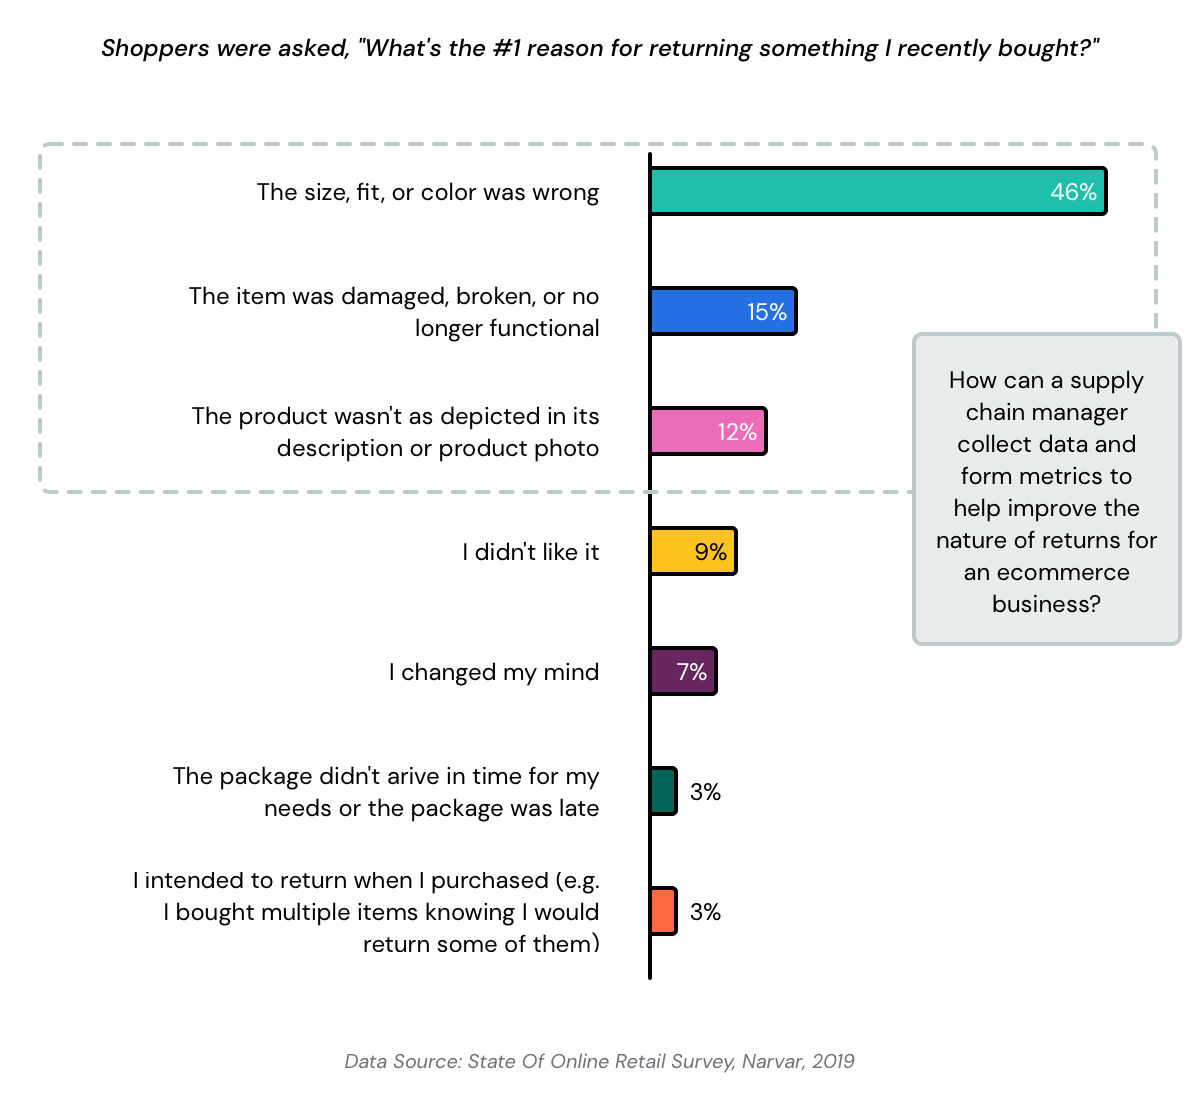
For ecommerce companies, returns can be a hard puzzle. Returns are part of modern ecommerce and can’t be entirely avoided. You can improve processes and data to reduce some of them, but you can’t get rid of them, so it’s important that you are good at them in a way that doesn’t completely destroy your margins.
Subsequently, supply chain managers should keep a close tabs on metrics to mature the return process and incorporate them into reverse logistics analytics.
- “Where Is My Return?” (WISMR) - Total volume and total percentage of customer support cases where the customer is asking for their return credit, meaning you are still going through the process of receiving and organizing a return.
- Recovery rate - Percentage breakdown of the resalability of returned goods. Worst case is you burn it in the parking lot. Best case is the item is undamaged and you can sell it again. Middle ground is that the item still qualifies for liquidation or can be sold used. For ecommerce, the middle ground is considerably more viable because used channels online are unique compared to physical retail. Online discount channels garner more eyeballs than physical stores, which increases the probability of a resale. Subsequently, ecommerce supply chain managers want to help minimize the worst case, versus maximize the best case, which is what older B&M retailers have to do.
Customer-centric metrics are cross-functional
Winning ecommerce companies prioritize metrics that put the customer first. It’s hard to do, though, because they are inherently cross-functional. It requires a shift in company perspective. The result, however, is supply chain analytics that propel the business towards profit and gross margin growth that beats competitors.
- Order to Deliver (Click to Deliver) - The single most important metric for ecommerce supply chains. The only thing that matters to a customer is when they get the thing they ordered. This is a composite of Order-to-Ship and Ship-to-Deliver.
- Delivery Accuracy - Percentage of the time that you delivered on the date you said you would.
- Delivery Cost - Percent of time that the delivery cost was what you quoted. Why is this customer-centric? Because if you are constantly over performing and coming in cheaper than you are quoting, those are savings you can pass onto customers and eventually get to “free” shipping which is a top customer preference.
- “Where Is My Order?” (WISMO) - Total volume of customer support cases where the customer is asking for their order. If this is high, it means your supply chain is too slow or opaque, and could impact repeat purchases.
- Out of Stock Rate - How often a product was out of stock when a customer visited the product page.
- Out of Stock Bounce Rate - How often a customer immediately left your site after seeing a product was out of stock.
- Availability - Customers want to buy things. How long it takes to go from manufacturing to being in stock on your site is the most customer-centric way to define the inbound supply chain.
Leverage Shipium as part of your supply chain analytics software stack
Ecommerce logistics move faster than traditional supply chains, requiring agile, data-driven decisions. Shipium is a modern logistics platform designed to help enterprise retailers and ecommerce brands make smarter, data-driven shipping decisions.
Our system ensures retailers shift from descriptive analytics (what happened) to prescriptive analytics (what should happen), enabling them to proactively improve fulfillment speed, reduce costs, and enhance customer satisfaction.
With the Shipium platform, ecommerce brands can move beyond fragmented, outdated systems and centralize supply chain analytics, metrics, and automation in one place. Request a demo today to see how Shipium can elevate your supply chain analytics.
Frequently asked questions
How are big data and analytics transforming supply chain management?
Big data and analytics give ecommerce companies greater insight into their logistical operations, helping to transform conventional supply chain management paradigms. Key changes include:
- Predictive demand forecasting to optimize inventory and reduce stockouts
- Logistics based on artificial intelligence (AI) and machine learning (ML) that streamlines carrier selection and improves delivery speeds
- IoT and sensor-based tracking for real-time shipment tracking
- Automation and prescriptive analytics to improve fulfillment strategies and reduce inefficiencies
Modern supply chain analytics tools, like Shipium, integrate real-time data with automation, allowing businesses to shift from reactive decision-making to enhance supply chain performance.
How to use analytics in supply chain management?
To effectively use analytics in supply chain management, businesses should:
- Collect accurate data from multiple sources, including your enterprise resource planning (ERP), carrier networks, and other systems
- Monitor key supply chain metrics like order-to-ship time, fulfillment accuracy, and shipping costs
- Run predictive analytics to improve demand planning and decision making
- Implement supply chain analytics software, like Shipium, to centralize data, avoid information silos, perform simulations, and optimize fulfillment tactics
By leveraging data analysis, companies can make smarter, faster, and more cost-effective logistics decisions.
How do I choose the right supply chain analytics tools for my ecommerce business?
Choosing the right supply chain analytics tool comes down to understanding what your business needs and how data can help you improve operations. Start by identifying your biggest challenges — are you struggling with high shipping costs, inaccurate demand forecasting, or slow fulfillment?
The right tool should give you real-time visibility, help you forecast demand, and even automate decisions like selecting the best carrier or fulfillment center. Look for features like:
- Integrations with your existing systems (OMS, WMS, TMS, ERP)
- Customizable reports
- AI-driven insights that actually help you make better decisions
Before committing, compare pricing and test-drive a few platforms. Many providers, like Shipium, offer demos, so take advantage of that to see how well a tool fits into your workflow.